

Deep Engineering #13: Designing Staleness SLOs for Dynamo-Style KV Stores with Archit Agarwal
Make “eventual” measurable: N/R/W tuning, staleness SLIs, instrumentation, and repair budgets.


Welcome to the thirteenth issue of Deep Engineering.
Eventual consistency is a fact of life in distributed key‑value stores. The operational task is to bound staleness and make it observable.
This issue features a guest article by Archit Agarwal that builds a Dynamo‑style store in Go from first principles—consistent hashing, replication, quorums, vector clocks, gossip, and Merkle trees—without hiding the details. Building on it, our feature turns those primitives into a staleness SLO. We cover selecting N/R/W, defining SLIs (stale‑read rate, staleness age, convergence time), sizing anti‑entropy and hinted‑handoff budgets, and placing instrumentation on the read and write paths.
Agarwal is a Principal Member of Technical Staff at Oracle, where he engineers ultra‑low‑latency authorization services in Go. He also writes The Weekly Golang Journal, focused on turning advanced system design into practical tools, with a consistent emphasis on performance and operational efficiency.
You can start with Agarwal’s walkthrough for the mechanics, then read today’s feature for SLIs/SLOs, alert thresholds, and more.

Designing Staleness SLOs for Dynamo‑Style KV Stores with Archit Agarwal
In an eventually consistent, Dynamo-style key-value store, not all reads immediately reflect the latest writes – some reads may return stale data until replication catches up. Staleness is the window during which a read sees an older value than the freshest replica. Defining a Service Level Objective (SLO) for staleness makes this behavior explicit and measurable, so teams can control how “eventual” the consistency is in operational terms.
Control surfaces for staleness
In Dynamo-style systems, three parameters shape staleness behavior: N, R, and W. N is the replication factor (number of replicas per key). R and W are the read and write quorum counts – the minimum replicas that must respond to consider a read or write successful. These define the overlap between readers and writers. If you choose quorums such that R + W > N, every read set intersects every write set by at least one replica, guaranteeing that a read will include at least one up-to-date copy (no stale values) under normal conditions.
Tuning R and W affects latency and availability. A larger R means each read waits for more replicas, reducing the chance of stale data but increasing read latency (and failing if fewer than R nodes are available). A larger W similarly slows writes (and risks write unavailability if W nodes aren’t up) but ensures more replicas carry the latest data on write acknowledge. The replication factor N provides fault tolerance and influences quorum choices: a higher N lets the system survive more failures, but if R and W aren’t adjusted, it can also increase propagation delay (more replicas to update) and the quorum sizes needed for consistency. Under network partitions, a Dynamo-style store can choose to continue with a partial quorum (favoring availability at the cost of serving stale data) or pause some operations to preserve consistency – R, W, N settings determine these trade-offs on the CAP spectrum (for example, a low R/W will serve data in a partition but possibly outdated, whereas high R/W might block reads/writes during a partition to avoid inconsistency).
Read path vs. write path: On writes, a coordinating node sends the update to all N replicas but considers the write successful once W replicas have acknowledged it. Only those W (or more) nodes are guaranteed to have the new version when the client gets a “success”. The remaining replicas will receive the update asynchronously (hinted handoff or background sync).
Here is a simplified Go snippet enforcing a write quorum:
// Write quorum acknowledgement check
if ackCount >= W {
    fmt.Println("Write successful")
} else {
    fmt.Println("Write failed: insufficient replicas")
}
This check ensures the write isn’t confirmed to the client until at least W replicas have persisted it. Operational impact: we can instrument this point to count how often writes succeed versus fail quorum. A high failure rate (ackCount < W) would hurt availability, whereas a success with only W acknowledgments means N - W replicas are still lagging – a window where stale reads are possible. On reads, the coordinator contacts R replicas (often via a digest query). It waits for R responses and, typically, returns the latest version among those responses to the client (often using timestamps or vector clocks to identify freshness). If R < N, the coordinator might not see some newer replica that wasn’t queried, so it’s possible the client got a slightly stale value. That’s why ensuring quorum overlap (R+W > N) or using R = N mitigates staleness. Still, even with quorums, if a write just succeeded with W acks, there may be N−W replicas not updated yet; a subsequent read that happens at a lower consistency level or before repair could encounter an older copy. In summary, R and W are the dials: crank them up for fresher reads (at the cost of latency/availability), or dial them down for speed and uptime (accepting a higher stale-read window).
What to Measure: Staleness SLIs and SLO
To manage staleness, we define Service Level Indicators (SLIs) that capture how stale the data is, and set SLO targets for them. Key metrics include:
Stale-read rate: the fraction of reads that return data older than the newest replica’s value at the moment of read. In practice, a “stale read” can be flagged if a read request did not fetch the most up-to-date version that exists in the system. (Detecting this may require the coordinator to compare all R responses or consult a freshness timestamp from a designated primary.) This rate should ideally trend toward 0% once the system has quiesced after writes. It directly indicates how often users see outdated data.
Staleness age: the time difference between the value’s timestamp (or version) that a read returned and the latest write timestamp for that item at read time. This measures how old the data is.
Convergence time: how long it takes for a write to propagate to all N replicas. Even after a write is acknowledged (at W nodes), the remaining replicas might get the update later (through gossip or anti-entropy). Convergence time can be measured by tracking the time from write commit to the time when the last replica has applied it. We should aim to keep convergence time low (and predictable) so that the window for stale reads (N−W replicas catching up) is bounded.
Repair backlog: the amount of data needing anti-entropy repair. This can be measured in number of keys or bytes that are out-of-sync across replicas. For example, if using Merkle trees for anti-entropy, we might track how many tree partitions differ between replicas, or how many hints are queued waiting to be delivered. In Cassandra, metrics like Hints_created_per_node reflect the number of pending hinted handoff messages per target node. A growing repair backlog indicates the system is accumulating inconsistency (replicas lagging behind) – which threatens the staleness SLO if not addressed. Operators should budget how much lag is acceptable and tune repair processes to keep this backlog small.
Hinted-handoff queue depth: if the system uses hinted handoff (buffering writes destined for a temporarily down node), this is a specific backlog metric tracking how many hints are stored and waiting. A large queue of hints means one or more replicas have been down or slow for a while and have many writes to catch up on. This directly correlates with staleness: those downed replicas might serve significantly stale data if read (or will cause consistency repair load when they recover). Monitoring the hints queue (count and age of oldest hint) helps ensure a down node doesn’t silently violate staleness objectives by falling too far behind.
Vector clock conflict rate: the rate at which concurrent updates are detected, leading to divergent versions (siblings) that need reconciliation. Dynamo-style systems often use vector clocks to detect when two writes happened without knowledge of each other (e.g. during a network partition or offline write merges). Each unique conflict means a client might read two or more versions for the same key – an extreme form of staleness where causal order is unclear. We measure the proportion of operations (or writes) that result in conflict reconciliation. A higher conflict rate suggests the system is frequently writing in partitions or without coordination, requiring merges and possibly exposing clients to multi-version data. Lowering conflict rate (via stronger quorums or a “last write wins” policy) usually reduces stale anomalies at the cost of losing some update history. In Agarwal’s Dynamo-Go implementation, vector clocks are represented as:
// Vector clock representation
type VectorClock map[string]int
Each node’s counter in this map increments on local updates. When a write is replicated, the vector clocks are merged. If a read finds two concurrent
VectorClockstates that neither dominates (i.e., different nodes each advanced their own counter), it indicates a conflict. We could emit a metric at that point (e.g.conflict_versions_total++). Tracking this helps quantify how often clients might see non-linear history that needs merging. A rising conflict rate might trigger an alert to consider increasing W or improving network reliability.
With these SLIs defined, we can now set an SLO for staleness. Typically, an SLO will specify a threshold for staleness that should be met a certain percentage of the time. For example, an organization might decide: “95% of reads should have a staleness age below 500 milliseconds, and stale-read occurrences should stay under 0.1% of all reads.” Such an SLO sets clear expectations that nearly all reads are fresh (within 0.5s of the latest data) and very few return old data. It’s important to pair these objectives with alerting thresholds and operational responses:
Example SLO (Staleness) – Target: P95 staleness age ≤ 500 ms, and stale-read rate ≤ 0.1% (per 1 hour window). Alerts: If 95th percentile staleness exceeds 500 ms for more than 10 minutes (primary alert), on-call should investigate lagging replicas or network issues (possible causes: replication failing, anti-entropy backlog). If it exceeds 500 ms intermittently (e.g. 5 minutes in an hour – secondary warning), schedule a closer look at load or repair processes. Likewise, if stale-read rate rises above 0.1%, a primary alert signals potential consistency problems – operators might check for nodes down or heavy write load overwhelming W acknowledgments. A secondary alert at 0.05% could warn of a trend toward SLO violation, prompting checks of the hinted-handoff queue or Merkle tree diffs. We also set an absolute convergence time cap: e.g. maximum convergence time 5 s at P99.9. If any write takes more than 5 s to reach all replicas, that’s a primary alert (perhaps a replica is stuck or a stream is failing – check the repair service or consider removing the node from rotation). A softer alert at 3–4 s convergence can help catch issues early. Runbook notes: on stale-read alerts, first identify if a particular replica or region is lagging (e.g. check the repair backlog metrics and hint queues). On convergence-time alerts, verify the anti-entropy jobs aren’t backlogged or throttled, and look for network partitions. The SLO is met when these metrics stay within targets.
Anti-Entropy and Repair Budgets
Achieving a staleness SLO requires active repair mechanisms to limit how long inconsistencies persist. Dynamo-style systems use two complementary approaches: read repair and background anti-entropy. Read repair triggers during a read operation when the system discovers that the replicas contacted have mismatched versions. In Cassandra, for example, if a quorum read finds one replica out-of-date, it will update that replica on the spot before returning to the client. The client gets the up-to-date value, and the involved replicas are made consistent. Read repair thus opportunistically burns down staleness for frequently-read data – the more a piece of data is read, the more chances to fix any replica that missed a write. However, read repair alone isn’t enough for rarely-read items (which might remain inconsistent indefinitely if never read). That’s where background anti-entropy comes in.
Background anti-entropy tasks (often using Merkle trees or similar data digests) run periodically to compare replicas and repair differences in bulk. Each replica maintains a Merkle tree of its key-range; by comparing trees between replicas, the system can find which segments differ without comparing every item. A simple representation of a Merkle tree node in Go might look like:
type MerkleNode struct {
    hash  []byte
    left  *MerkleNode
    right *MerkleNode
}
Using such trees, a background job can efficiently identify out-of-sync keys and synchronize them. The cadence and rate of this repair job act as a budget for staleness: if you run anti-entropy more frequently (or allow it to use more bandwidth), inconsistencies are corrected sooner, reducing worst-case staleness. For example, if repairs run every hour, a replica that missed an update will be stale at most an hour (ignoring hints) before the Merkle tree comparison catches it. If that’s too long for your SLO, you might increase repair frequency or switch to continuous incremental repair.
It’s important to configure repair rate limits so that anti-entropy doesn’t overwhelm the cluster. Repair can be I/O-intensive; throttling it (e.g. limiting streaming bandwidth or number of partitions fixed per second) prevents impact to front-end latency but prolongs how long replicas remain inconsistent. The SLO provides a guideline here: if our SLO is “staleness age P95 < 500ms”, and we notice background repairs are taking minutes to hours to cover the dataset, that’s a mismatch – we’d need either a faster repair cycle or rely on stronger quorums to mask that delay.
Membership churn (nodes leaving or joining) can rapidly inflate the repair backlog. For instance, when a node goes down, any writes it misses will generate hints and differences. If it’s down for 30 minutes, that’s 30 minutes of writes to reconcile when it comes back. If nodes frequently fail or if we add new nodes (which require streaming data to them), the system could constantly be in “catch-up” mode. Operators should track how quickly repair debt accrues vs. how fast it’s paid off.
Parameter Playbook: N, R, W Trade-offs
To concretely guide tuning, here’s a playbook of quorum settings and their qualitative effects. Each row shows a representative (N, R, W) configuration, the quorum overlap (R + W – N), tolerance to failures, and the read/write latency-consistency trade-off:
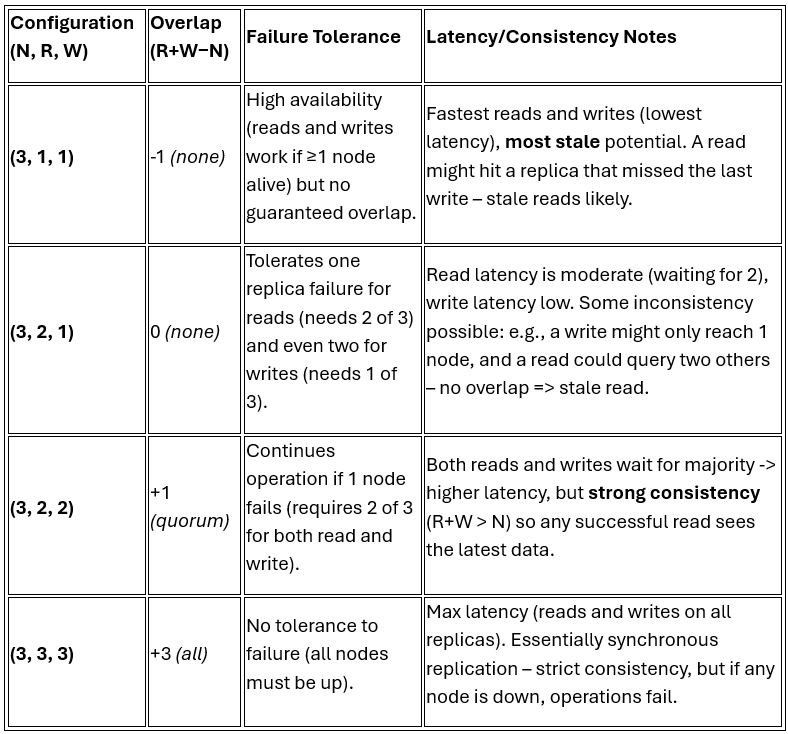
In practice, many deployments choose a middle ground like (N=3, R=2, W=1) or (N=3, R=1, W=2) for eventually consistent behavior, or (R=2, W=2) for firm consistency. The overlap formula R + W – N indicates how many replicas’ data a read is guaranteed to share with the last write; positive overlap means at least one replica in common (so a read will catch that write), zero or negative means it’s possible for a read to entirely miss the latest writes. As shown above, larger quorums improve consistency at the expense of latency and fault tolerance. Smaller quorums improve performance and fault tolerance (you can lose more nodes and still operate) but increase the chance of stale responses. When setting an SLO, you can use this table to pick a configuration that meets your freshness targets.
(Note: The table uses N=3 for illustration; higher N follow similar patterns. For instance, (5, 3, 1) has overlap -1 (fast writes, slow-ish reads, likely stale), whereas (5, 3, 3) has overlap +1 (quorum consistency), and (5, 4, 4) would have overlap +3 but little failure tolerance).
Implementation Hooks and Metrics
Finally, let’s tie these concepts to the actual implementation (as in Agarwal’s Dynamo-style Go store) and discuss where to instrument. We’ve already seen how write quorum enforcement is coded and where we could count successes/failures. Another crucial piece is replica selection – knowing which nodes are responsible for a key. Agarwal’s store uses consistent hashing to map keys to nodes. For a given key, the system finds the N replicas in the ring responsible for it:
// Replica selection for a key (basis for R/W placement and convergence measurement)
func (ring *HashRing) GetNodesForKey(key string) ([]ICacheNode, error) {
    h, err := ring.generateHash(key)
    if err != nil {
        return nil, err
    }
    start := ring.search(h)
    seen := map[string]struct{}{}
    nodes := []ICacheNode{}

    for i := start; len(nodes) < ring.config.ReplicationFactor && i < start+len(ring.sortedKeys); i++ {
        vHash := ring.sortedKeys[i%len(ring.sortedKeys)]
        node, _ := ring.vNodeMap.Load(vHash)
        n := node.(ICacheNode)
        if _, ok := seen[n.GetIdentifier()]; !ok {
            nodes = append(nodes, n)
            seen[n.GetIdentifier()] = struct{}{}
        }
    }
    return nodes, nil
}
This function returns the list of nodes that should hold a given key (up to N distinct nodes). It’s the backbone of both the write and read paths – writes go to these N nodes, reads query a subset (of size R) of them. From an SLO perspective, GetNodesForKey provides the scope of where we must monitor consistency for each item. We could instrument right after a write is accepted to track convergence. Also, if a read at consistency level < ALL is performed, using this function we could compare the version it got to other replicas’ versions – if one of the other replicas has a higher version, that read was stale. This check could increment the stale-read counter. Essentially, GetNodesForKey lets us pinpoint which replicas to compare; it’s where we “measure” consistency across the replica set.
For conflict detection, we already discussed vector clocks. Instrumentation-wise, whenever the system merges vector clocks (after a write or read repair), it can check if the merge resulted in multiple surviving branches. If yes, increment the conflict metric. The VectorClock type above is simple, but in usage, e.g., vc1 := VectorClock{ "nodeA":5, "nodeB":3 } and vc2 := VectorClock{ "nodeA":5, "nodeB":4 } would be compared – if neither dominates, you have a conflict. By observing how often that happens (and perhaps how many versions result), we quantify the “consistency anomalies” experienced.
Throughout the code, there are many places to emit metrics: when writes succeed or fail the quorum check, when read repair runs (count how many rows repaired), size of hinted-handoff queues, etc. The key is to map them to our SLO. For instance, after the Write successful log above, we might record the lagging replicas count (N - ackCount) for that write – if >0, that write contributes to potential staleness until those catch up. Summing such lag over time or tracking the max lag can inform convergence times. Similarly, each read could log the staleness age (now - last_write_timestamp seen) for that item. These instrumentations ensure that the theoretical SLI definitions (stale-read rate, staleness age, etc.) have concrete counters and timers in the running system.
With careful tuning (quorum sizes, repair cadence) and diligent monitoring, teams can reap the benefits of high availability while keeping staleness within acceptable bounds.
🧠Expert Insight
Archit Agarwal’s guest article provides the implementation details of these mechanisms in Go:
Building a Distributed Key-Value Store in Go: From Single Node to Planet Scale

Most of us have either used or at least heard of systems like Redis or DynamoDB. But, have you ever wondered what kind of engineering headaches their teams had to deal with while building these giants?
🛠️Tool of the Week
FoundationDB – Open-Source, Strongly Consistent Distributed Database
FoundationDB is a distributed key-value store that delivers strict serializable ACID transactions at scale, letting teams build multi-model services (documents, graphs, SQL-ish layers) on a single fault-tolerant core.
Highlights:
End-to-End Transactions: Global, multi-key ACID transactions with strict serializability simplify correctness versus eventually consistent or ad-hoc sharded systems.
Layered Multi-Model: Build higher-level data models (queues, doc/graph, catalog/metadata) as “layers” on top of the core KV engine—one reliable substrate for many services.
Resilience by Design: Automatic sharding, replication, and fast failover; continuous backup/restore and encryption options for enterprise reliability.
Deterministic Simulation Testing: Each release is hammered by large-scale fault-injection simulation, yielding exceptional robustness under node and network failures.
📎Tech Briefs
Skybridge: Bounded Staleness for Distributed Caches by Lyerly et al. | Meta Platforms Inc. and OpenAI: This conference paper describes Skybridge, a lightweight system developed at Meta that provides fine-grained, per-item staleness metadata for distributed caches, enabling best-effort or fail-closed bounded staleness (e.g., two seconds) at global scale by indexing recent writes across all shards, detecting replication gaps, and allowing cache hosts to prove most reads are fresh without re-fills—achieving up to 99.99998% 2-second consistency with minimal CPU, memory, and bandwidth overhead.
DAG-based Consensus with Asymmetric Trust (Extended Version) by AMORES-SESAR et al.: This paper proves that naïvely swapping threshold quorums for asymmetric ones breaks DAG common-core (“gather”) primitives, then introduces a constant-round asymmetric gather and, from it, the first randomized asynchronous DAG-based consensus for asymmetric trust that decides in expected constant rounds.
Rethinking Distributed Computing for the AI Era by Akshay Mittal | Staff Software Engineer at PayPal: This article calls for rethinking distributed computing for AI, highlighting how current architectures clash with transformer workloads and advocates for AI-native designs such as asynchronous updates, hierarchical communication, and adaptive resource use, drawing on DeepSeek’s sparse Mixture-of-Experts model.
Repairing Sequential Consistency in C/C++11 by Lahav et al.: This paper identifies that the C/C++11 memory model’s semantics for sequentially consistent (SC) atomics are flawed, and proposes a corrected model called RC11 that restores soundness of compilation, preserves DRF-SC, strengthens SC fences, and prevents out-of-thin-air behaviors.
Amazon SQS Fair Queues: a New Approach to Multi-Tenant Resiliency: Introduced in July 2025, this is a new feature that automatically mitigates noisy neighbor effects in multi-tenant message queues by prioritizing messages from quieter tenants to maintain low dwell times, combining the performance of standard queues with group-level fairness without requiring changes to existing consumer logic.
That’s all for today. Thank you for reading this issue of Deep Engineering. We’re just getting started, and your feedback will help shape what comes next. Do take a moment to fill out this short survey we run monthly—as a thank-you, we’ll add one Packt credit to your account, redeemable for any book of your choice.
We’ll be back next week with more expert-led content.
Stay awesome,
Divya Anne Selvaraj
Editor-in-Chief, Deep Engineering
If your company is interested in reaching an audience of developers, software engineers, and tech decision makers, you may want to advertise with us.