

From NIC to P99: Engineering Low-Latency C++ Trading Systems in 2026
A practical look at the hardware, OS, and code-level optimizations you need to stop burning your latency budget.

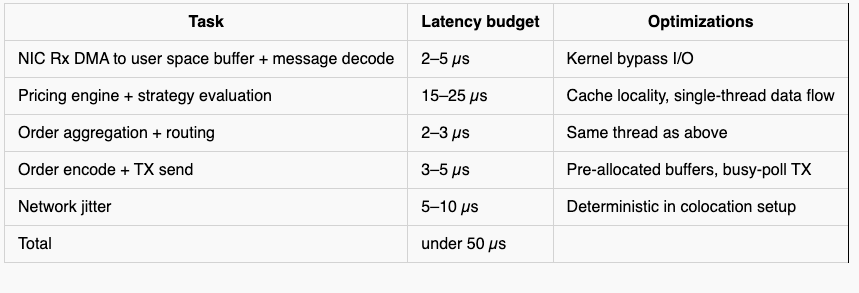
Trading systems have been evolving for decades, moving from manual execution based on charts and indicators to automated strategies that fire within tens of nanoseconds using FPGA and ASIC hardware. Both approaches still coexist today, but most advanced and systematic trading has moved into the sub-100 microsecond range. In this article I want to focus on the hardware and software aspects you need to understand in order to build a trading system with p95 wire-to-wire latency under 50 microseconds.
Traditional technology stacks like Java, JavaScript, TypeScript, and C# offer a lot of flexibility and scalability for large-scale applications, but their inherently nondeterministic nature makes it very difficult to get below a p50 latency of 500 microseconds. While there are ways to optimize garbage collection and other Java components for latency, most standard Java libraries do not focus on low-level concepts like aligning data to cache lines or reducing cache line misses. C and C++ applications optimize for a specific platform at the cost of portability, but that trade-off is exactly what gives you access to manual memory management and the ability to avoid multithreading pitfalls like false sharing. When the goal is to reduce latency, you need lower-level languages like C, C++, or Rust on critical paths. I will not cover pure hardware implementations like FPGAs or ASICs here since they are not required for our 50-microsecond latency target.
Important Definitions
Before diving into the architecture and hardware optimizations, it will be helpful to establish exactly how performance is measured in a low-latency environment.
Wire-to-wire latency
Wire-to-wire latency is measured from the moment a market data packet is received on the NIC from the exchange to the moment an order is sent back to the exchange on the same NIC. You compute it as order send timestamp minus market data receive timestamp. The most precise measurements require NIC cards with hardware timestamping enabled, so the NIC stamps every inbound and outbound packet with a hardware timestamp that you can later use to analyze the latency graph. Exanic cards provide APIs for retrieving these hardware timestamps.
Assumptions About the System
To hit the latency target of under 50 microseconds, you need to optimize both hardware and server setup alongside your software, and the following assumptions underpin everything in this article.
Colocated host: Most stock exchanges in traditional finance provide colocation services where your servers sit physically adjacent to the exchange’s servers, removing extra network jitter from the equation.
UDP market data access: Most stock exchanges distribute market data via UDP multicast to all subscribed parties, and this is the fastest way to consume and react to it.
Kernel bypass NIC: The system runs on NIC cards enabled for kernel bypass and tuned for low-latency operation.
Single venue: These systems are single-venue, meaning at any point they process market data to generate orders for one stock exchange only. For multi-venue setups, the assumption is one colocated host per venue with no shared critical-path processing.
Workload Model
Most of the trading systems follow this model of data processing in abstract terms:
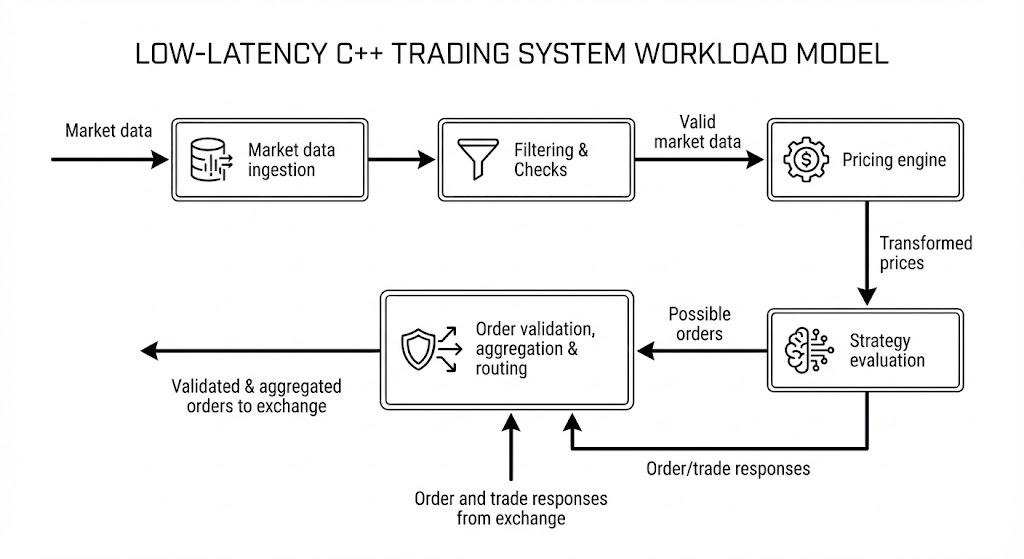
Every strategy engine takes market data from the exchange as its primary input and produces orders sent to the exchange as its primary output, moving through multiple stages as described below. Exchange responses are a secondary input to the engine but are not on the hot path for latency calculations.
Market Data Ingestion
The first layer is responsible for ingesting the market data (raw or normalized) from the network card. This layer routinely processes terabytes of data per day and can exceed a petabyte on busy days at venues like CME or Eurex. On an average day at CME you can expect 20 to 30 million trades and 100 to 150 million open interest events in a single segment. Processing a full L1 feed for one segment means receiving traffic in the range of a few terabytes to hundreds of terabytes per day, so both software and hardware need to be extremely optimized.
Filtering and Checks
Filtering and checks come next, cleaning up incoming data and validating it before it reaches downstream stages. This layer handles packet drops, invalid market data, trading phase transitions like moving from an active session to a halted one, and anomalous price changes that might indicate a software bug. When something goes wrong at this stage, the right response is often to instruct strategies to stop rather than pass bad data forward.
Pricing Engine
The pricing engine receives valid and normalized market data and can range from a simple no-op or currency conversion all the way to a full ML-powered model. Lightweight pricing fits comfortably on the critical path. Complex ML models that require large amounts of memory and processing do not, because they would blow the latency budget. In practice, ML-powered engines in low-latency applications split into two processes: time-consuming training and inference model preparation happen off the critical path, and a lightweight inference step runs on the critical path using small linearized models fed configuration parameters from the heavier ML output. This keeps the heavy lifting off the hot path while still giving the strategy access to model-driven signals. Colocation also constrains available compute, so you want to reserve it for work that directly impacts critical path performance.
Strategy Evaluation
Strategy evaluation compares transformed or theoretical prices against real prices and fires an order when it identifies an opportunity. Strategies generally fall into three categories.
Maker: Maker strategies keep quotes on both the buy and sell sides to provide liquidity and take advantage of the bid-ask spread. Exchanges often provide incentives to HFT firms that add liquidity this way.
Taker: Taker strategies identify mispricing and fire IOC or FOK orders for immediate execution.
Hedging: Hedging strategies reduce risk or book profit by executing the opposite side of an existing position.
Order Aggregation and Routing (OMS)
Order aggregation and routing (OMS) can be combined with strategy evaluation in simple setups, but should be separated as complexity grows. It serves three purposes: aggregating orders from multiple strategies to reduce the number of orders sent to the exchange, managing exchange responses and passing normalized results back to the strategy, and handling the routing logic that grows more complex as your strategy count increases.
Latency Map: Where the Latency Lies
Now that the high-level components are clear, it is worth mapping out where the latency actually sits so you can allocate your budget with precision. Beyond the business logic itself, your latency profile depends on CPU model and generation, NIC type and model, operating system, software architecture, and business logic complexity.
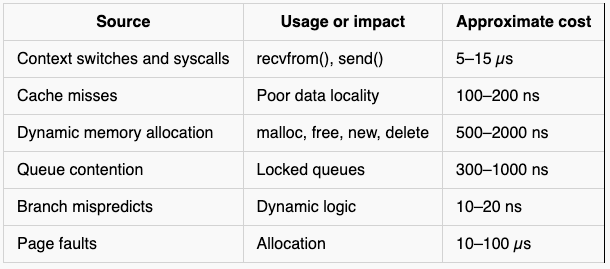
Beyond the business logic stages, several factors contribute latency that stays invisible if you only look at application code. These factors come from hardware, OS and kernel processing, network behavior, and I/O, and they play an outsized role in ultra-low-latency systems. Even if they occur infrequently, they introduce jitter and latency spikes that directly hurt your p99. Although many of these latency sources depend on a multitude of factors, you can work with approximate cost ranges that provide a useful benchmark, and the table below gives those ranges for the most common sources.
Engineering Pillars
Addressing these latency sources requires a set of engineering decisions baked into the application design itself, not patched in afterwards. The pillars below cover the most impactful areas.
Kernel Bypass
Traditionally, any application reading from the network goes through the kernel as an intermediary, which means a system call copies data from the NIC into kernel space before the application can access it by copying from kernel space into its own buffers. That double-copy plus the system call overhead adds up quickly because control needs to transfer to and from the kernel on every read, and the way to avoid it is to access the NIC directly through its driver. DPDK polling mode is one of the best approaches for this and can save roughly 20 to 45 microseconds when tuned correctly for market data processing.
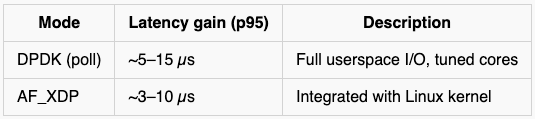
Specialized hardware is also worth considering for additional gains on top of software-level kernel bypass. Exanic and Solarflare cards are widely used in the trading industry and provide zero-copy data access, hardware filtering, hardware timestamps, and flexible flow steering.
Memory Management
Most shared or larger resources get allocated on the heap through dynamic allocation using malloc or new, which requires a system call to expand the heap and introduces additional latency. Low-latency systems avoid this by pre-allocating memory segments at startup and building custom allocators on top of those segments to distribute memory during runtime, with the primary goal of eliminating all system calls from the hot path entirely. At startup you make one large allocation to cover the maximum memory any component might need, and during trading hours your custom allocator distributes from that pool without ever touching the OS. Most large-scale systems package this into a library of containers, allocators, and pools that lets you use vectors, maps, and arrays without the penalty of dynamic allocation by implementing custom versions of these types or custom allocators.
In practice it is always worth benchmarking different allocators to find the one that performs best for your specific workload, since allocators have different configuration parameters that trade off between latency, throughput, and fragmentation.
CPU and NUMA Affinity
Modern CPUs use NUMA architecture, dividing processors into nodes where each node has its own processors, caches, and memory, and communication between nodes happens over interconnects that add measurable latency when crossed on a hot path. For critical processes, you want to pin threads to cores within the same NUMA node and ensure that the data those threads access is also allocated on the same node. Non-critical processes like logging, compliance reporting, and observability can run on a separate NUMA node since they care more about throughput than latency.
An example core allocation for a machine with 8 cores per NUMA node and 2 NUMA nodes might look like this.
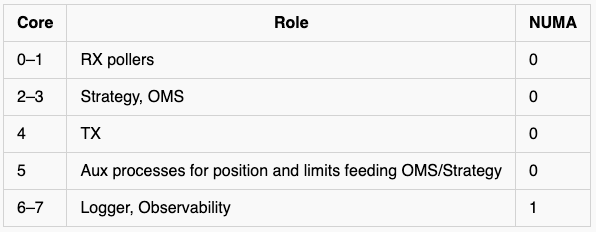
This layout lets you run two independent sets of strategies, one per NUMA node, while keeping logging and observability isolated from the critical path.
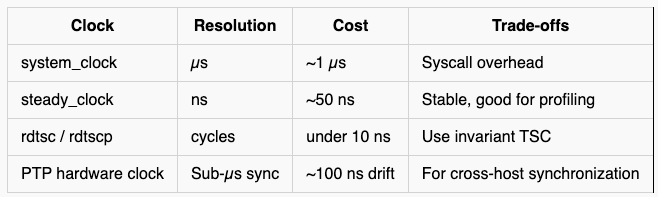
Time Sources and Clocks
Getting timestamps right matters a lot more in low-latency systems than in most applications because you are measuring at nanosecond granularity, and the table below covers the main options along with their trade-offs. For cross-host applications, you also need a way to synchronize time across multiple machines at nanosecond precision — PTP hardware clocks are the standard approach for this.
Network Tuning
Sockets and hardware both need tuning to get the best latency and throughput out of your setup. The key adjustments are disabling interrupts and relying on polling to avoid breaking application flow, increasing the RX buffer size to reduce packet loss, and increasing the TX buffer backlog queue size, with many other hardware-specific options available depending on your configuration.
Observability and Monitoring
Monitoring is not optional in low-latency systems because without good observability you cannot see where latency is being spent. The key metrics to track are first-order-out latency for both software and wire-to-wire paths, p50, p95, p99, and p99.9 latencies at both levels, syscall latencies using bcc and bpftrace, CPU utilization to find headroom and spot contention, and NIC-level metrics using tools appropriate to your hardware.
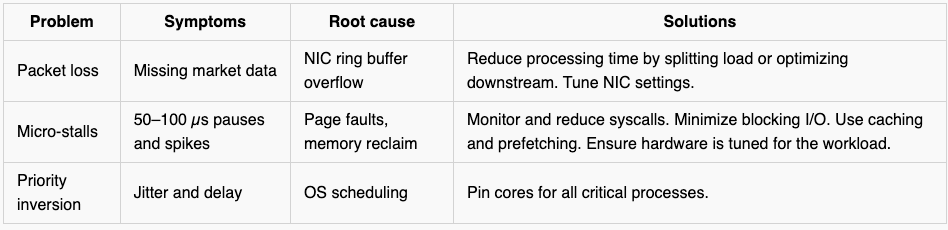
Failure Modes
Deployment Checklist
The hardware tuning techniques below are commonly used across trading organizations, but because you are tuning at the hardware level the right set of parameters depends on your specific hardware. These techniques also carry trade-offs like higher power consumption and increased CPU heat, so test carefully and find the optimal configuration for your application before applying them in production.
Hardware and BIOS
Disable C-states and Turbo Boost
Set CPU governor to performance mode
Lock PCIe ASPM off
Enable hugepages
OS Tuning
Use isolcpus, nohz_full, and rcu_nocbs kernel parameters
Apply sysctl buffer tuning
Use mlockall to pin memory and prevent paging
Process and Code
Use static preallocation and avoid dynamic containers on the hot path
Prefetch and cache-align structs
Use lock-free SPSC queues
Use TSC for all timing on the critical path
Common Pitfalls
False sharing between threads on the same cache line: This is one of the most common mistakes in multithreaded systems. When two threads write to variables that share a cache line, even if those variables are logically unrelated, the cache coherency protocol treats the entire line as contested and forces unnecessary cross-core coordination. Many cache miss problems in multithreaded environments trace back to this.
Chatty IPC over sockets or message queues: Chatty IPC adds up quickly. Many distributed systems default to message queues, RPCs, or other message-passing mechanisms, but these carry much higher latency in practice even when they scale better horizontally. For low-latency IPC between processes on the same host, shared memory is the right approach.
Premature SIMD optimization: Premature SIMD can actually increase latency when your workload is memory-bound rather than compute-bound. SIMD brings real benefits in the right situations but also adds complexity. Always benchmark before and after adding vectorization because the performance impact can go in either direction depending on your memory access pattern.
TSC skew across cores: TSC skew is a problem that bites HFT systems specifically because they measure at nanosecond granularity. TSC is the standard clock for critical path timing because it does not require a system call, but TSC can drift across cores on the same CPU. Left uncorrected, that skew introduces measurement errors that look like real latency spikes and can obscure genuine performance bugs. Check your CPU documentation for the recommended synchronization approach and apply it regularly.
Running without baseline histograms: Running without baseline histograms makes all of the above invisible. Every parameter including compiler settings, execution environment, hardware, and network can affect latency, and changing a single line of code can produce dramatically different results. Measuring p50 and p99 histograms at every stage of the pipeline is the only reliable way to know where your latency is coming from.
Further reading /Additional resources
AF_XDP: Zero-Copy Packet Processing in Linux — Netdev 2024:
BPF Performance Tools by Brendan Gregg
IPC vs shared memory:
Incorrect use of SIMD:
 |
|